A Beginners Guide to Basic Indexing
James Bannister • March 21, 2020 • 10 minute read
laravelI want to preface this post with a disclaimer; this literally is a 'beginners guide'. A while back, I was facing some performance issues with an application in production and this post is a walkthrough of the problem I was facing, and the steps I took to solve the problem. I am by no means an expert with databases, but as you'll see later in the post, I read some great articles by people who clearly knew more about this subject than I did, and this post is more about painting the full picture of how I knew I had a problem, how I diagnosed it, and then how I applied the knowledge I learnt from the aforementioned articles to improve my database average query time by up to 3,600%, drop CPU usage from 80% to 11%, and increased throughput of my queued jobs from 9 jobs per minute to 900.
First a little backstory
I feel it may be useful to paint the picture of what my application looks like. It's a Laravel application, using a PostgreSQL database, with Vue on the frontend. Whilst we are using Vue to help make the frontend more interactive, going from page-to-page still involves a full page reload and no state is persisted across each page. The application was coming up on 5 years old, yet it was running on the latest version of Laravel (currently 5.8 at the time).
So how did I know I had a problem
Around the middle of 2019, we released a big update to the application. This update was the culmination of ~5 months of work; involving a reskin of our entire front-end and a bunch of new or improved features. We were testing these changes as we went on local development machines and from within a staging environment, and didn't notice anything out of place; pages were loading correctly and within ~3-5 seconds depending on the page.
With everything looking good, we rolled our update out to production; and began to let our users know about the raft of improvements and new features. This quickly pulled in an influx
of users and our active user count sky-rocketed... as did our page load times. Pages went from the ~3-5 second load time to ~20-30 seconds!
Our application runs on one fairly beefy server; sporting 16GB of RAM and 6vCPUs, and our RAM usage was fairly low, but CPU was maxing out at 100%.
Using htop to sort processes by CPU usage quickly showed that Postgres queries were regularly chewing up our CPU.
I made a few changes over the coming days to improve areas of the codebase that I knew were running heavy or intensive queries, either by optimising the queries
(using with() and load() methods in the Eloquent queries or on the models) or by caching the results of expensive queries that were rarely changing.
This helped somewhat, and as traffic died down from the big release, page load times decreased as CPU usage went down.
We still had a problem though, during periods of higher traffic (usually overnight due to our userbase) the CPU usage was jumping to ~80% and users online at this time were regularly reporting slow load times on the website and through our apps. We knew that Postgres was the cause of these issues and that the more users who were online, the more active Postgres needed to be, and therefore the more CPU Postgres would consume. To solve this problem, we wanted to try moving our database off of our server and onto its own box. Our infrastructure is currently running on Digital Ocean and one of the services they offer is a managed PostgreSQL database. Not being a DBA myself, we decided to give this a shot; Digital Ocean would manage and optimise the instance and that was one less thing we needed to worry about. Plus the cost of using the managed database was easily justified when we looked at just how much time I was spending on looking into these issues.
With our managed Postgres instance up and running, data migrated, and production application running on it - everything looked great, and for a couple of months it was.
We have a calculated value that sits on one of our models. Every time the record is saved or updated, a job is dispatched to recalculate this value. Due to a change in some logic around how we wanted this value to be calculated, we needed to regenerate all of these values. To do this, I wrote a console command to loop through all these records and dispatch a job for each record to recalculate this value. This generated a queue of around 300,000 jobs, that due to the nature of what is involved in calculating this value, needs to run one by one. Each job needs to fetch some further information needed for the calculation (maybe there is a future optimisation here, but that's outside the scope of this). The queue began processing, and was processing ~25 records per minute; at 300,000 jobs that's over 8 days! Fine, OK, whatever, it is what it is; I'm not entirely happy about how long it will take but I have other things I need to work on and given we don't usually calculate hashes across all our records it's fine. Our application is fairly popular during the week, however usage definitely spikes over the weekend. The weekend rolls around, and I'm midway through a Saturday with the family when I'm getting pinged about really slow response times on the app and the web. I jump onto our server and everything is looking good there, so I jump onto the dashboard for our managed database and CPU is sitting at 99% to 100%. I open Horizon on our application and the queued jobs are now down to between 5 and 9 per minute and going to take close to two weeks to clear.
The database problem never went away, I just kept treating the symptoms and this kept biting me down the line.
Identifying the problem
So I know I have a problem with CPU consumption, I now need to figure out why.
Bad or hung queries
My initial search on the internet and asking around in chat groups was that there could be some hung queries. To see if there are any hung queries, you can run
1SELECT max(now() - xact_start)2FROM pg_stat_activity3WHERE state IN ('idle in transaction', 'active');This will return the total time a query has been running that is in an idle or active state; and therefore could be hogging resources.
In my case this returned nothing; my problem did not stem from a hung query.
Bad queries or missing indexes
My online search coincided with a comment from @mtimbs:
It sounds like there could be some bad queries or missing indexes
I was hesitant to pin this on bad queries as I'd already reviewed all the queries (as I mentioned earlier).
Indexes, however were something I'd never given much attention to. I knew that they were something you could configure on your database tables, but I didn't know much more.
One StackOverflow post provided this query as a way to identify whether or not you may have missing indexes:
1SELECT relname, 2 seq_scan - idx_scan AS too_much_seq, 3 CASE 4 WHEN seq_scan - idx_scan > 0 5 THEN 'Missing Index?' 6 ELSE 'OK' 7 END AS result, 8 pg_relation_size(relid::regclass) AS rel_size, 9 seq_scan,10 idx_scan11FROM pg_stat_all_tables12WHERE schemaname = 'public' AND13 pg_relation_size(relid::regclass) > 8000014ORDER BY too_much_seq DESC;The above will return the table name, and an indication of whether you are running too many sequential scans or not. It is also taking into account the table size, as indexes don't add all that much benefit if the table size is small.
Here is an example of what one could look like:
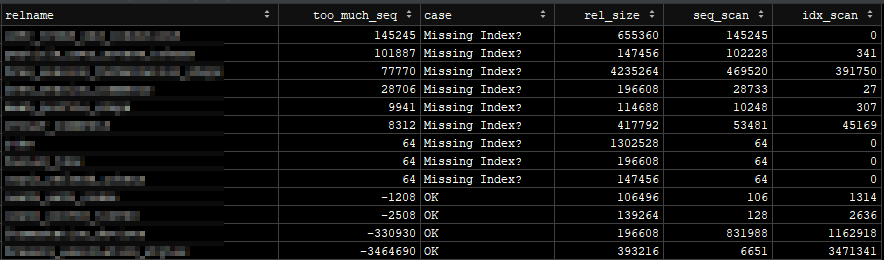
This is great (OK it's bad, but it's good news), we now know that we are definitely missing some indexes - so let's start looking at how we can resolve this.
Adding indexes
Not knowing a tonne about indexes, I needed to study up on both how to add these and what to include in them. This blog post was the best post that I found from the few that I read through. Pavel does a great job at explaining what tools to use and how to use them to figure out what index to write.
One key bit of advice I picked out of this post was:
We advise to create one index per unique query for better performance.
Identifying where to add indexes
If your application is fairly large, the above statement can be quite a daunting undertaking; one index per unique query. One of the neat features of Digital Ocean's managed PostgreSQL instances is
their 'Logs & Queries' tab. This provides some good insights on current queries, recent logs, and most importantly query statistics:
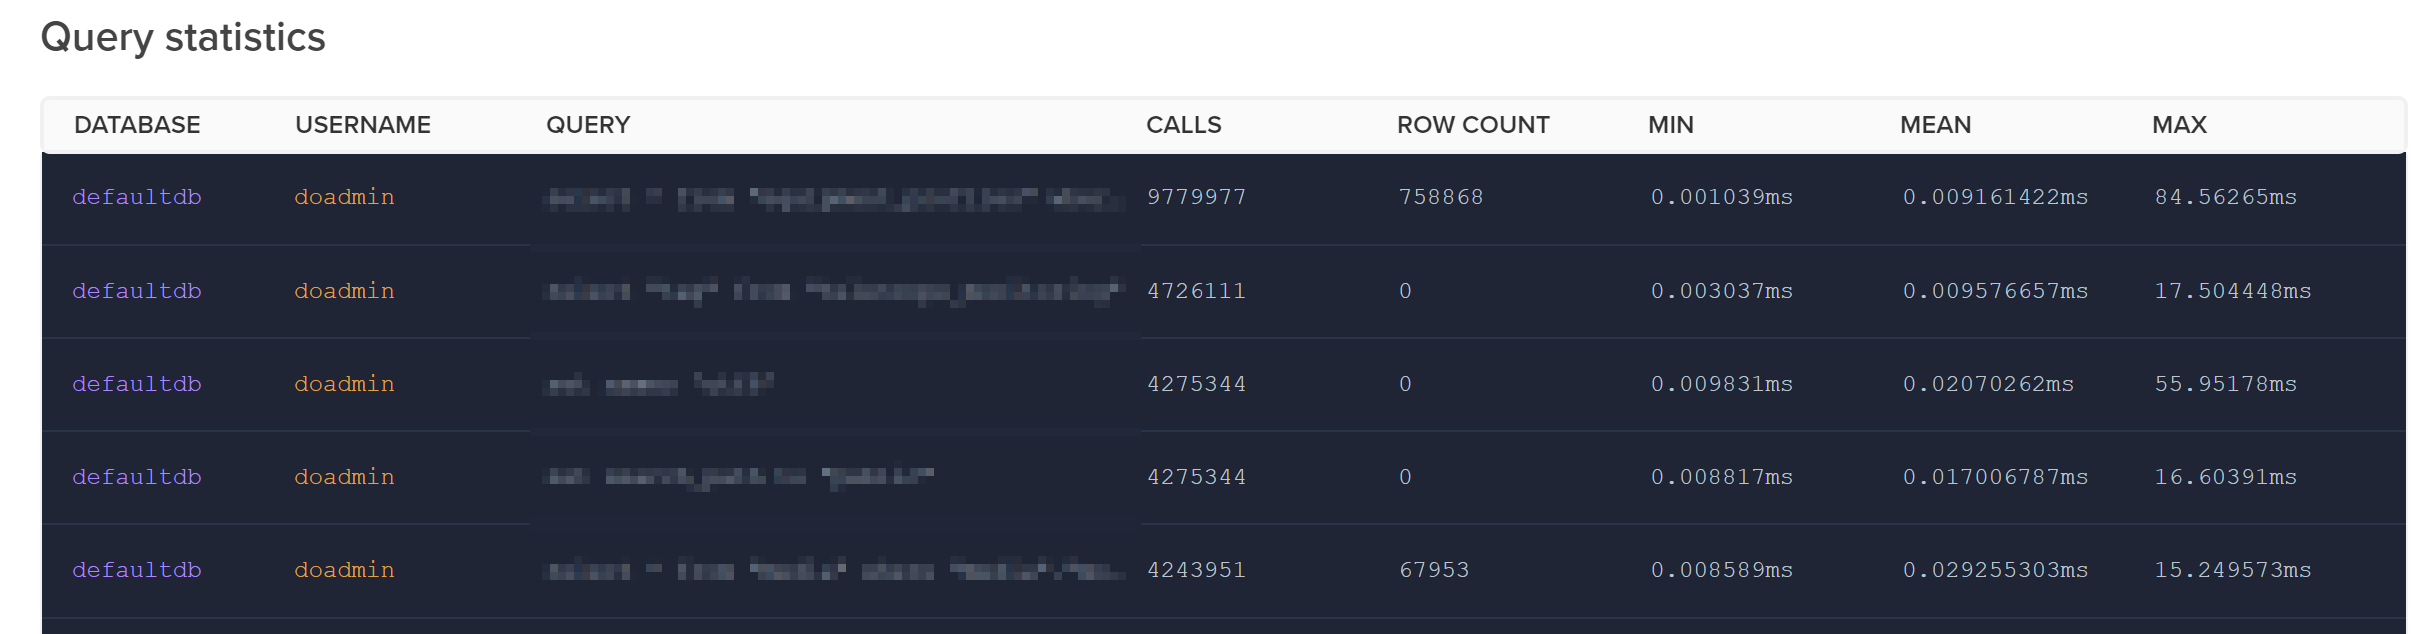
If you don't have something similar from within wherever your database is managed, Postgres does come with this baked in with pg_stat.
I exported the query statistics from within this dashboard and then ordered the queries by their mean run time; this allowed me to start with the queries that were running the longest on average.
Adding an index
In some RDBMS, specifying a foreign key on a table will automatically create an index for it; this is not the case in PostgreSQL. The reason that some RDBMS create indexes for foreign keys is because this is a great way to speed queries up; and is usually where your biggest wins will be made.
Let's take a sample query from my application. There is a table called foos that can have many bars. foos has an id column that links to a foo_id column in the bars table.
When using our Foo model to fetch the related Bar records, our query will look like:
1SELECT *2FROM bars3WHERE foo_id = ?Without an index, Postgres will need to perform a sequential scan to get all records from the bars table and then filter out what it doesn't need; this usually means you are fetching a large amount of
data when all you're really after is a small subset.
If we construct the required index, Postgres can use that rather than having to perform the sequential scan. It's important to note that PostgreSQL (and other RDBMS) evaluate their options before running a query; they'll build a plan for a sequential scan and any index scans and then decide which they think will be faster and use it. For that reason, if we think back to the quote from Pavel above, if we specifically construct an index for each unique query then we get an index that is customised completely for it; meaning it should be optimised for the rows you are querying and therefore Postgres should be using the index rather than a sequential scan.
A/B test your query before and after adding an index
There is no point adding an index, and subsequently taking up disk space, if it doesn't improve your query speed. Thankfully there is a great utility built into PostgreSQL already to help us do this;
EXPLAIN ANALYZE. This command will execute the trailing query and subsequently tell you how it executed the query and how long it took.
Using the previous example, it would look like this:
1EXPLAIN ANALYZE2SELECT *3FROM bars4WHERE foo_id = ?I'm not a DBA expert, so the information it printed about how it was scanning wasn't overly important to me. The key piece of information I was look at was the planning and execution time.
My process was pretty simple, run EXPLAIN ANALYZE on query I was looking to optimise, then add an index and re-run the EXPLAIN ANALYZE.
After adding an index, I was looking for a significant drop in the execution time. You might ask what significant was; in most cases, my problem queries were going from ~5ms to ~0.05ms - 100 times faster! My biggest improvement, on a rather big query between two tables went from 20ms to 0.08ms!
Sequential Scans vs Index Scans vs Index Only scans
The performance of a query seems to be very much related to how the table needs to be scanned to generate your results.
Sequential Scans
A sequential, or full table scan, is a scan where each row of a table is read one after the other and then filtered on any conditions in the query.
For example
1SELECT *2FROM barsWill read each row one by one and include them all as there are no conditions on the query.
Or
1SELECT *2FROM bars3WHERE foo_id = ?Will read each row and check if it has the matching foo_id.
Index Scans
Index scans are where an index is used to assist in the lookup of matching rows. Indexes store a reference to the underlying row in the table, and so when an index is faster to scan, Postgres will use that and then with the resulting records, fetch them from the table.
Using the previous query:
1SELECT *2FROM bars3WHERE foo_id = ?If we add an index for foo_id, it will be quicker to search for matching records in the index and then use this to grab the remaining columns we're after from the underlying table.
Index Only Scans
Index only scans are almost self-explanatory; this is when there is an index that contains the exact data that you are querying for and the rows are returned directly from the index.
Whilst you may think that index only scans sound like exactly what you want, you need to be careful if you are creating multi-column indexes in the effort to get index only scans.
Heroku Dev Center explain the trade offs well:
As always, indexes come with a cost, and multi-column indexes can only optimize the queries that reference the columns in the index in the same order, while multiple single column indexes provide performance improvements to a larger number of queries.
Let's add an index
With all that said, let's see some examples of adding an index for a common query:
1-- Query2SELECT *3FROM bars4WHERE foo_id = ?5 6-- Index7CREATE INDEX bars_foo_id8ON bars(foo_id)This would create an index that would be used to help speed up what would otherwise be a sequential scan.
Another example:
1-- Query2SELECT item_id, SUM(price)3FROM order_items4WHERE item_id = 15GROUP BY item_id6 7-- Index8CREATE INDEX order_items_item_id_price9ON order_items(item_id, price)In the example above, order matters. We are filtering on item_id, but need price to be in the index to perform an index only scan. If we put price first in the index (i.e ...ON(price,item_id)), then the resulting index is sorted on price and then item_id.
Using this index in such a state is almost equivalent to running a sequential scan as the data is not in state that we can efficiently read it; as we are wanting to filter by item_id first and then lookup price.
Results
I worked my way through my list of slowest queries and added a total of 16 indexes. The results were staggering once these were deployed into production... you can literally see the exact moment these went live:

Previously we were struggling to handle 100 concurrent users, now we could handle 1,000s with ease.
Although, the most noticeable improvement was on our queue. Periodically, we have to regenerate a computed value on one of our tables. To do this, it needs to read into 4 other related tables, which were previously unindexed. This job is unique in that it needs to process only one record at a time and run sequentially. Kicking this off, I had ~220,000 records to process.
Looking in Horizon, I saw that this queue was processing roughly 9 records per minute, and was pretty much grinding the database to a halt doing so. Users were reporting performance issues, and this was easily verified by browsing the site and seeing 15 second response times. This bottleneck was what kicked off my investigation into all this. I added these indexes after about 3 days, at which point only about 40,000 records had been processed. At which point, load dropped on the database and the records per minute sky rocketed to 900 per minute; 100 times faster.
I hope you found this useful. If you have any feedback, thoughts, or different approaches to this then I'd love to hear from you; I'm @jryd_13 on Twitter.
Thanks!